STATS TRACKERS FORTNITE – The gaming community has recently become more aware of data-driven actions, and Fortnite is no exception. Players who play the game for more than just fun has learned how vital historical statistical data is and how it affects how they play it.

Many people play Battle Royale, and the other game modes that Epic Games offers, but others want to improve their skills, master the game, and compete in tournaments like FNCS. These players use data from the past to figure out how they play and where they can improve. This is where Fortnite stats trackers come in.
As the name suggests, a stats tracker is an online tool that shows statistics from the past. There are a lot of tools that players can use, depending on what they need. This article aims to teach people how to use stat trackers to their advantage.
DON’T MISS: Chrome Structures Fortnite – How to destroy it
A guide to the numbers and history of Fortnite
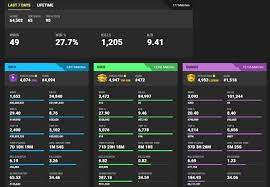
Most Fortnite stat trackers use the same flowchart for their operations and show some key metrics. This helps players understand how they’re doing. Figure out important trends based on how they play, and determine how far their skills can go. Visualizing data has made it much easier to understand trends, even if the text is hard to read.
The following metrics can help players make sense of the data, figure out how they play, and improve their skills:
- Wins: This is the number of times a player has won a Victory Royale.
- Matches: The total number of Fortnite games that have been played so far.
- Win Rate = Number of Wins / Number of Games.
- Kills – The number of people who have died so far.
- Death – The number of times a player has died without getting a Victory Royale.
- Kill Death Ratio (K/D) is the number of kills a player has compared to how many times they have died.
Time played is the number of hours a player has spent playing. (Time is often broken up into smaller chunks that show things like the average length of a match and more.)
The key statistics that show how well a player has done in the past are listed above. Readers should know that some third-party stats trackers also show extra information that is just an extension of the critical metrics listed above.
Figuring out what the data mean
Now that readers know more about key metrics and what to look for, the next step is to read the data and figure out what it means. Players need to understand the information given because it points out essential indicators to help them make decisions based on facts.
Players can use different mathematical operators and formulas to get results. For example, if they compared their average match length to their K/D ratio, they would know how often they kill and die in a certain amount of time. In turn, this information will help them make decisions based on data and fix problems in their game causing this.
Visualized data
Visualized data is better at getting information across than other types of data. Graphics are a better way to show how different things work and display numbers in an easier way to understand. Interested players can start by keeping track of their stats for Chapter 3, Season 4. This will help them make decisions about their performance based on facts.
ALSO READ: KLOMBOS FORTNITE – WILL KLOMBOS RETURN IN CHAPTER 3 SEASON 4 FORTNITE